How to interpret your TapeStation plots
On this support page, you can find more information on the interpretation of TapeStation plots. You can find these plots in the lab QC update email we will send after the processing of your samples. It is possible to jump to different sections by using the contents menu on the left (desktop) or at the top (smartphone).
Introduction
During processing, our lab Services team checks the quality of your bulk RNA-seq, SORT-seq, VASA-seq, or 10x Genomics samples and libraries at different stages. One of the methods used is automated electrophoresis, which visualizes the RNA or DNA fragments in your sample. At Single Cell Discoveries, our lab team uses the Agilent 4200 TapeStation System.
TapeStation plots will provide information about RNA or DNA fragments on two things:
- Size distribution
- Concentration
Keep in mind that TapeStation plots are a global reflection of quantity, as measurements are only performed on pooled cells or samples. It is not possible to assess the exact number of cells in your samples via these plots. This can only be determined by sequencing.
Up until January 2023, our lab team used the Agilent 2100 Bioanalyzer Instrument. The results of the TapeStation and Bioanalyzer data can be considered equivalent. You can find more information comparing the two systems in the chapter TapeStation and Bioanalyzer.
TapeStation QC | Bulk RNA sequencing
Workflow
- Your samples arrive. We perform the total RNA extractions from TRIzol if the RNA is not yet isolated.
- Depending on the number of cells per sample, as indicated by the customer, we determine if there is enough starting material for RNA concentration normalization between samples and preliminary QC before starting library preparation.
- If there is enough starting material, we perform concentration normalization for preliminary QC and further sample processing. The normalized, extracted RNA is run on an Agilent TapeStation to assess the state of the total RNA. This results in a total RNA plot (see below).
- If the total RNA is of good quality, the samples are processed for library preparation. This includes reverse transcription with barcoding primers, second-strand synthesis, pooling, clean-up, and in vitro transcription (IVT). IVT is a linear amplification step that results in amplified RNA (aRNA).
- We fragment the aRNA and run this, after clean-up, on an Agilent TapeStation to assess its quality and the RNA yield after IVT. This results in an aRNA plot (see below).
- After confirmation that aRNA quality is sufficient, we continue library preparation with another reverse transcription step and PCR amplification. This results in a complement DNA (cDNA) library. The samples are then cleaned up.
- We run the cleaned cDNA library on an Agilent TapeStation. This results in a cDNA plot (see below).
- Finally, we send the cDNA library out for sequencing if the cDNA plot looks good.
Total RNA plot
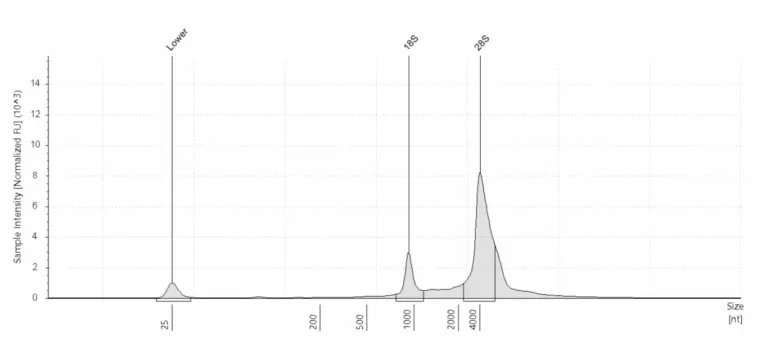
A Total RNA plot shows the total amount of RNA in a sample after extraction. In every total RNA plot, you first see a marker peak at 25 nt. For mammalian samples, there should be two very distinct peaks, approximately at 1500–2000 nt and 3000–5000 nt, that indicate the amount of intact RNA. These are the ribosomal 18S and 28S peaks. Peaks between the marker peak and the ribosomal peaks indicate degraded material.
For quantified quality control, we calculate the RINe score. The ratio of the two ribosomal peaks to the total area under the curve determines the RINe score. The RINe score can range from 1 to 10, with RINe = 10 indicating the least degraded RNA and RINe = 1 indicating complete RNA degradation. We recommend proceeding with library preparation only when the RINe ≥ 6 for mammalian samples.
In general, total RNA extracts show similar electrophoresis results (i.e., ribosomal peaks) between different species. For other cell types, such as zebrafish, algae, or other non-mammalian organisms, we judge the preliminary QC from case to case.

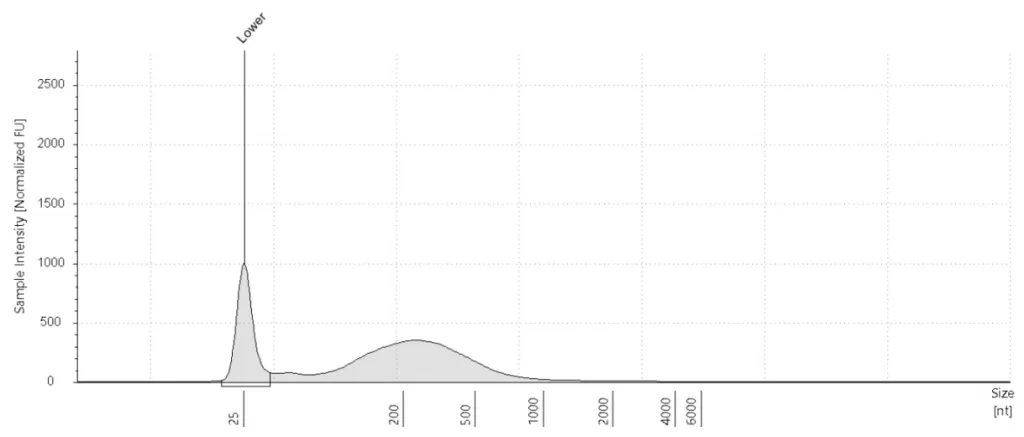
aRNA plot
An aRNA plot shows the amount of amplified RNA in the sample after IVT. Every aRNA plot first shows a peak at 25 nucleotides (nt). This is a marker peak. What should follow is a distinct, right-skewed RNA “bump” that indicates the aRNA amount. A small “extra bump” may precede the RNA curve. This is a primer-dimer peak and does not interfere with the quality of your sample.
How the plot is interpreted
The amount of aRNA can vary depending on the cell type and the number of cells. For this reason, a low aRNA yield in some situations is not always unexpected. In cases where the number of cells was not enough to normalize before IVT, the aRNA yield can be on the low side.
This does not have to be an issue as we correct for this by increasing the number of PCR cycles during further library preparation. The number of cycles is determined by the aRNA concentration as calculated from the aRNA plot.
RINe score
The aRNA plot also shows the RINe score. It is important to note that the RINe score has no meaning for aRNA plots. The RINe score is only applicable for Total RNA electrophoresis as it requires the ribosomal peaks for its calculation. As our protocol is poly-A-tail-based and as we fragment the aRNA before running it on the TapeStation, the RINe score can therefore be ignored for aRNA samples.
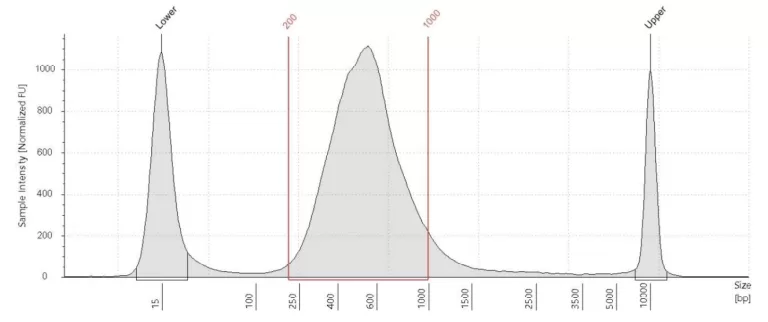
cDNA plot
A cDNA plot shows the amount of cDNA in the sample after PCR amplification. Every cDNA plot has two marker peaks: one at 35 bp and one at 10380 bp. There should be a clear and smooth curve between these markers that goes up at around 200 bp and is back at baseline at approximately 2,000 bp.
The curve’s height depends mainly on the number of PCR cycles and aRNA starting material amount. These are generally controlled, and interpreting the cDNA plot should usually be straightforward. However, in the case of very low starting material, the cDNA amount can still be limited even at maximal cycle numbers. The shape of a cDNA curve can vary between samples. This mostly depends on the cell type.
It is important to keep in mind that a good DNA library may still produce poor data, but this is something that can only be determined by sequencing and data analysis.
TapeStation QC | SORT-seq
Workflow
- Your plates arrive.
- We perform cell lysis, reverse transcription, and second-strand synthesis.
- We pool the material from all wells of one plate into a single Eppendorf tube to perform in vitro transcription (IVT). IVT is a linear amplification step that results in amplified RNA (aRNA). We fragment the aRNA and run it on an Agilent TapeStation. This results in an aRNA plot (see below).
- We continue library preparation with another reverse transcription step and PCR amplification. This results in a complement DNA (cDNA) library. The samples are then cleaned up.
- We run the cleaned cDNA library on an Agilent TapeStation. This results in a cDNA plot (see below).
- Finally, we send the cDNA library out for sequencing.
aRNA plot
An aRNA plot shows the amount of RNA in the sample after IVT. Every aRNA plot first shows a peak at 25 nucleotides (nt). This is a marker peak. What should follow is a distinct RNA “bump” that indicates the aRNA amount. A small “extra bump” may precede the RNA curve. This is a primer-dimer peak and does not interfere with the quality of your sample.
How the plot is interpreted
We categorize a sample’s RNA yield as low, mid, or high based on the aRNA plot. We evaluate the sample by taking several considerations into account.
Experience has shown that a mid- or high-range RNA yield usually results in useful data. However, with a high aRNA yield, there still is a possibility that only a handful of cells yielded RNA but that each of these cells has a (very) high RNA content. These cells might thus be overrepresented in the sequencing data.
The amount of RNA can be expected to vary depending on the cell type, the quality of the cells, the number of cells, and the quality of the reaction. For this reason, a low aRNA yield in some situations does not have to be unexpected. One cause of this can be low-RNA-expressing cells, RNA from nuclei, etc. The cell type can sometimes indicate the expected yield beforehand, but this is not always the case.
RINe score
The aRNA plot also shows the RINe score. It is important to note that the RINe score has no meaning for aRNA plots. The RINe score is only applicable for total RNA electrophoresis, which is not part of our SORT-seq protocol, and it can therefore be ignored for aRNA samples.
cDNA plot
A cDNA plot shows the amount of cDNA and the distribution of fragment sizes in the sample after PCR amplification. Every cDNA plot has two marker peaks: one at 15 bp and one at 10380 bp. There should be a clear and smooth curve between these markers that goes up at around 200 bp and is back at baseline at approximately 2,000 bp.
The height of the curve depends mostly on the number of PCR cycles but can be limited by a low RNA yield. A very low to absent RNA yield will usually result in a low(er) DNA curve even at the maximal cycle number. It’s likely that little to no (useful) data can be obtained from this library. When the DNA library looks good, there is likely (some) useful data in this library. The library can then be sent for sequencing. However, keep in mind that a good DNA library does not guarantee good data quality and that this can only be determined by sequencing and data analysis.
Even with a poor-looking cDNA QC result, it can be useful to sequence one or more of the libraries for confirmation and to find out why the libraries appear suboptimal. Sequencing results can help determine what can be improved for a potential next sort.
Tapestation QC | 10x Genomics
Workflow
- Your samples have arrived.
- We prepare your sample for 10x Genomics: thaw the cells/tissues, lyse and extract nuclei or recover methanol-fixed cells.
- Single-cell/nuclei suspensions are counted and assessed for viability and aggregation (cells) or integrity and aggregation (nuclei) via an automated cell counter.
- When the QC in the previous step aligns with 10x Genomics standards, we proceed with 10x Genomics Chip loading, reverse transcription, and cDNA amplification.
- We run the cleaned amplified cDNA on an Agilent TapeStation. This results in an amplified cDNA plot (see below).
- We proceed with library construction: gene expression, V(D)J libraries, or Feature Barcoding libraries, depending on the chosen 10x Genomics protocol.
- We run the cleaned final libraries on Agilent TapeStation. This results in a final library plot (see below).
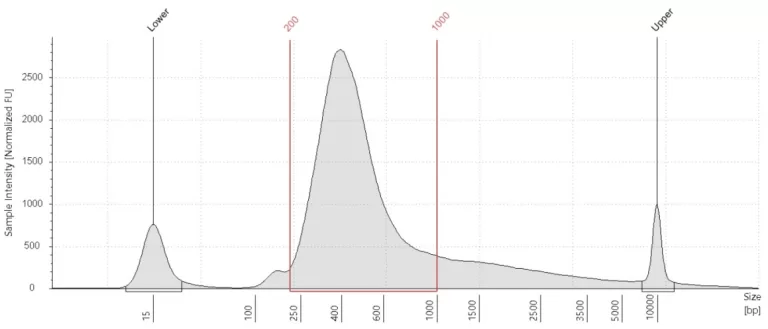
Amplified cDNA plot
How the plot is interpreted
When there is a clear curve between 400 bp and 9,000 bp, centered around 1,000 bp, we deem the reverse transcription and amplification steps successful. Actual size distribution varies depending on the sample type. However, this QC step does not guarantee successful 10x Genomics GEM (Gel beads-in-emulsion) creation, as this can only be determined by sequencing and data analysis.
The height of the cDNA curve depends on the number of cells loaded onto the 10x Genomics Chip and subsequent PCR cycles.
Additional cDNA amplification is performed for V(D)J libraries.
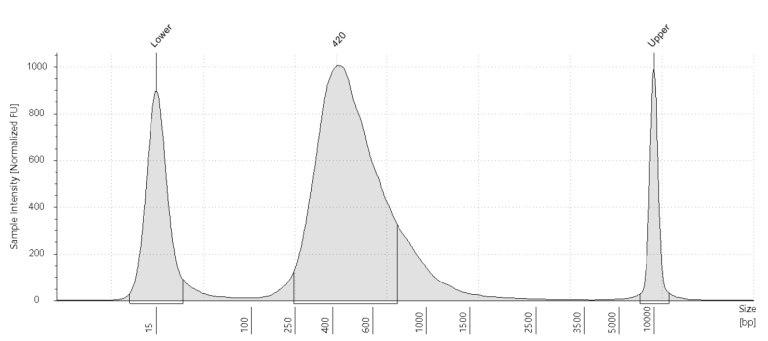
Final library plot
How the plot is interpreted
In Gene expression libraries, a clear curve between 200 bp and 1,000 bp, centered around 500 bp, indicates successful library construction. Minor peaks lower than 200 bp are common and indicate primer dimers, which do not affect the data quality.
V(D)J libraries display different profiles depending on their type (T Cell Receptor or B Cell Receptor), expression levels in the sample, and cell number chosen for the experiment.
Feature barcoding libraries usually display uniform peaks centered at 200 bp.
If the final libraries display low curve height, we perform additional PCR cycles to amplify the signal and ensure sequencing quality.
Tapestation QC | VASA-seq
Workflow
- Your plates arrive.
- We perform cell lysis, end repair and poly-A tailing, reverse transcription, and second-strand synthesis.
- We pool the material from all wells of one plate into a single Eppendorf tube to perform in vitro transcription (IVT). IVT is a linear amplification step that results in amplified RNA (aRNA). We fragment the aRNA and run it on an Agilent TapeStation. This results in an aRNA plot (see below).
- We continue with library preparation and PCR amplification. This results in a complement DNA (cDNA) library. The samples are then cleaned up.
- We run the cleaned cDNA library on an Agilent TapeStation. This results in a cDNA plot (see below).
- Finally, we send the cDNA library out for sequencing.

aRNA plot
An aRNA plot shows the amount of RNA in the sample after IVT. Every aRNA plot first shows a peak at 25 nucleotides (nt). This is a marker peak. What should follow is a distinct RNA “bump” that indicates the aRNA amount. An extra bump may precede the RNA curve. This is a primer-dimer peak and does not interfere with the quality of your sample.
How the plot is interpreted
With VASA-seq there is often plenty of aRNA as these libraries contain total RNA rather than mRNA only. However, with a high aRNA yield, there still is a possibility that only a handful of cells yielded RNA but that each of these cells has a (very) high RNA content. These cells might thus be overrepresented in the sequencing data.
The amount of RNA can be expected to vary depending on the cell type, the quality of the cells, and the number of cells. For this reason, a low aRNA yield in some situations is not necessarily unexpected. One cause of this can be low-RNA-expressing cells, for example nuclei. The cell type can sometimes indicate the expected yield beforehand, but this is not always the case.
RINe score
The aRNA plot also shows the RINe score. It is important to note that the RINe score has no meaning for aRNA plots. The RINe score is only applicable for total RNA electrophoresis, which is not part of our VASA-seq protocol, and it can therefore be ignored for aRNA samples.
cDNA plot
A cDNA plot shows the amount of cDNA in the sample as well as the distribution of fragment sizes in the sample library after PCR amplification. Every cDNA plot has two marker peaks: one at 15 bp and one at 10380 bp. There should be a clear and smooth curve between these markers that goes up at around 200 bp and is back at baseline at approximately 2,000 bp
How the plot is interpreted
The height of the curve depends mostly on the number of PCR cycles but can be limited by a low RNA yield. When the DNA library looks good, there is likely (some) useful data in this library. The library can be sent for sequencing. However, keep in mind that a good DNA library does not guarantee good data quality and that this can only be determined by sequencing and data analysis.
Even with a poor-looking cDNA QC result, it can be useful to sequence one or more of the libraries for confirmation and to find out why the libraries appear suboptimal. Sequencing results can help determine what can be improved for a potential next sort.
TapeStation and Bioanalyzer
Agilent’s TapeStation and Bioanalyzer are electrophoresis systems that allow for fast and reliable separation, sizing, and quantification of DNA and RNA. The electrophoresis process is automated and miniaturized to surpass the intensive labor of slab gels. Furthermore, these systems reduce reagent consumption, allow for reproducibility, and visualize sample fragment sizes in clear plots.
Recently, we have made the switch from the Bioanalyzer system to the TapeStation system. Whereas the Bioanalyzer system works with microfluidic chips, the TapeStation system uses ScreenTapes that have individual lanes so that each sample is analyzed individually. An important feature of the TapeStation is that it gives the flexibility to run any sample number at a time for a constant cost. Additionally, the TapeStation can process up to 96 samples as it can be loaded with a 96-well plate. Taken together, this switch improves the flexibility and scalability of our QC.