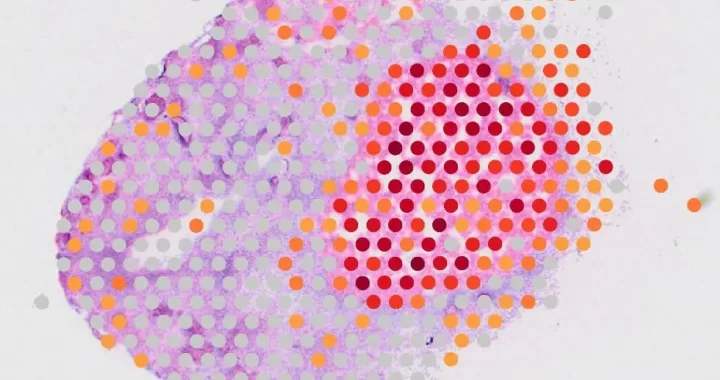
Recently we have added the 10x Genomics Visium Spatial Gene Expression solution to our portfolio. The Visium workflow generates two types of data: an H&E or Immunofluorescence (IF) tissue image and sequencing data in FASTQ files. But what are the options once you receive your data?
Here, we provide you with an overview of tools you can use for your Visium data analysis.
10x Genomics software
10x Genomics provides users of the Visium Spatial Gene Expression solution with two solutions for data analysis and visualization: the Space Ranger pipeline and the Loupe Browser.
Space Ranger
Space Ranger is a set of analysis pipelines that process Visium Spatial Gene Expression data. The pipelines allow you to demultiplex your samples, map the data and align your mapped gene expression data to the coordinates of the spatial gene expression slide.
Space Ranger uses the RNA-seq aligner STAR for fresh-frozen samples or a probe aligner algorithm for FFPE tissues. These gene expression count tables aligned with the microscopy images allow you to create anatomical maps of your sample based on an image of your tissue with H&E or IF staining.
Read more about Space Ranger here.
Loupe Browser
The Loupe Browser is an interactive browser to analyze and visualize data from different 10x Genomics solutions, including Visium Spatial Gene Expression. Both your gene expression data and your tissue image are loaded in the Loupe Browser. This allows for interactive analysis of your transcriptomics data within the context of your tissue.
It allows you to focus on specific genes, characterize and refine clusters, and perform differential gene expression analysis—all with your mouse in an interactive user interface.
Read more about the Loupe Browser here.
Other data analysis options
Many pipelines and software types support the processing of Visium Spatial Gene Expression data. Here we give two examples of software that we already use for single-cell RNA sequencing data analysis.
Seurat
Seurat is a popular tool for single-cell RNA sequencing and can also be used for spatial transcriptomics, including Visium Spatial Gene Expression.
New functionalities have been added that can overlay the transcriptomics data on the tissue histology image and provide the ability to make an interactive plot.
It allows you to normalize, do clustering analysis, integrate with single-cell RNA sequencing data, and enable you to work with multiple slices.
You can find a tutorial of how to use Seurat for Visium Spatial Gene Expression here
BioTuring
The BioTuring Browser is an interactive tool to analyze single-cell RNA sequencing data. The BioTuring Browser also supports Visium Spatial Gene Expression data with a Spatial Transcriptomics dashboard. This dashboard helps scientists interactively analyze and visualize their data.
It allows for creating tSNE and UMAPs, overlay gene expression on the tissue image, and do differential gene expression across clusters of spots on the spatial gene expression slide. The Visium Spatial Transcriptomics module also allows for instant access to spatial transcriptomics datasets.
View here an example of Visium data analyzed with the BioTuring Browser.
This was an overview of some of the options for Visium data analysis. Interested in a Visium Spatial Gene Expression project? You can discuss your project with one of our specialists.


