Multi-year clinical trials place extraordinary demands on bioanalytical laboratories. When the same patient samples are measured repeatedly over months or years, small systematic shifts in assay performance can quietly distort the picture of treatment response. Different reagent lot batches and sample matrices both contribute to this risk. In longitudinal immunological studies, that kind of drift is more than a technical inconvenience. It can undermine confidence in the data entirely.
We recently helped a clinical trial sponsor address this challenge using the Olink Target 48 Cytokine panel. The findings show why rigorous inter-batch variability assessment benefits any regulated clinical proteomics program, and how the right analytical framework turns uncertainty into trustworthy data.
The analytical approach
We assessed inter-batch variability across the full panel, covering cytokines and chemokines including IFN-γ, TNF-α, IL-1β, IL-6, VEGF-A, and many others. Two complementary analyses drove the evaluation:
Coefficient of Variation (% CV) by protein (A)
We calculated the CV for each analyte across batches and sample types. Most proteins showed low-to-moderate inter-batch CV (green and light peach bars in the chart). A smaller subset showed higher variability (orange and dark orange bars). This protein-level view is essential: it tells you which analytes you can compare directly across batches and which need additional bridging or normalisation.
 Weighted Deming regression (B)
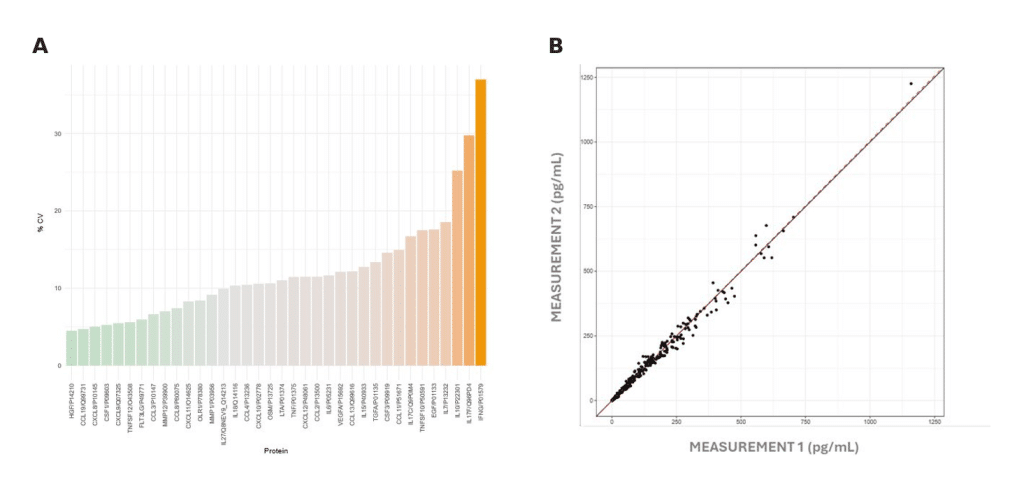 Weighted Deming regression (B)
We applied Weighted Deming regression as a method-comparison analysis to test agreement between two independent batches. The results were clear: intercept 0.0318 (bias 0.0015, p = 0.076), slope 1.0051 (bias −0.00024, p = 0.464). Neither proportional nor constant bias reached statistical significance across the measurement range. The scatter plot confirms tight clustering around the line of identity, with strong agreement from low to high concentrations (0–1250 pg/mL).
"Where CV tells you which individual proteins to watch closely, Deming regression tells you whether the two batches are, as a whole, measuring the same thing."
In line with published validation data
Olink's own published data for the Target 48 Cytokine panel reports mean intra-assay and inter-assay CVs of 4% and 6%, respectively, across all 45 analytes [Validation data Target 48 Cytokine]. IFN-γ stands out as the highest-variability analyte, with an inter-assay CV of 11% — a pattern our inter-batch data also reflects. This is exactly why protein-level CV analysis matters: it surfaces outliers like IFN-γ rather than hiding them in a panel-level average.
A 2026 inter-laboratory study across four commercial laboratories independently confirmed this performance. Three of four sites produced concordant results, and 43 of 45 biomarkers received a rating of good or moderate reliability. Together, these findings support the panel's use in biomarker studies and clinical applications .
Why quantification demands analyte-level validation
Olink Target 48 Cytokine delivers calibrated protein concentrations in pg/mL using a qPCR-based readout. That is a meaningful step beyond relative expression units. As a result, it also raises the bar for what analytical validation must demonstrate. When results inform clinical decisions or regulatory submissions, quantitative precision must match documentation and quality standards that withstand scrutiny.
Breadth brings complexity
High-plex panels like Olink Target 48 measure many proteins at once. That breadth enables discovery of unexpected biomarker signals alongside pre-specified endpoints. However, it also introduces analytical complexity. Not every protein performs equally well across all lot batches, sample types, and storage conditions — as the protein-level CV data in this study shows.
Therefore, characterising performance at the individual analyte level — and using that data to define fit-for-purpose comparability criteria — is SCD's standard recommendation across our clinical proteomics portfolio. This approach is not overhead. It is the difference between data and evidence.